






Starting or growing a print-on-demand store takes more than a good design. You need to know where the market stands and what buyers want. Print-on-demand statistics give you that view.
In this guide, you'll find the latest numbers on market size, top-selling products, profit margins, and key trends for 2026. Each section explains what the data means for your shop. Use these insights to choose the right niche, set fair prices, and plan your next step.
Key Takeaways
- The global POD market should reach $57.5 billion by 2033, up from $10.8 billion.
- Apparel holds 39.5% of the market, but home decor is growing fastest.
- A $25 PrintKK tee leaves $10.10 before platform fees, assuming $5 ad spend.
- Basic platform fees take 6% to 11%; ads and affiliate commissions cost more.
- About 60% of online sales happen on mobile, so listings must work on phones.
21 Print-on-Demand Statistics and Trends for 2026
We pulled these print-on-demand statistics from market research reports, company filings, a government notice, Semrush, and one academic study. Everything here was published in 2025 or 2026.
1. The Global POD Market Is Projected to Reach $57.5 Billion by 2033
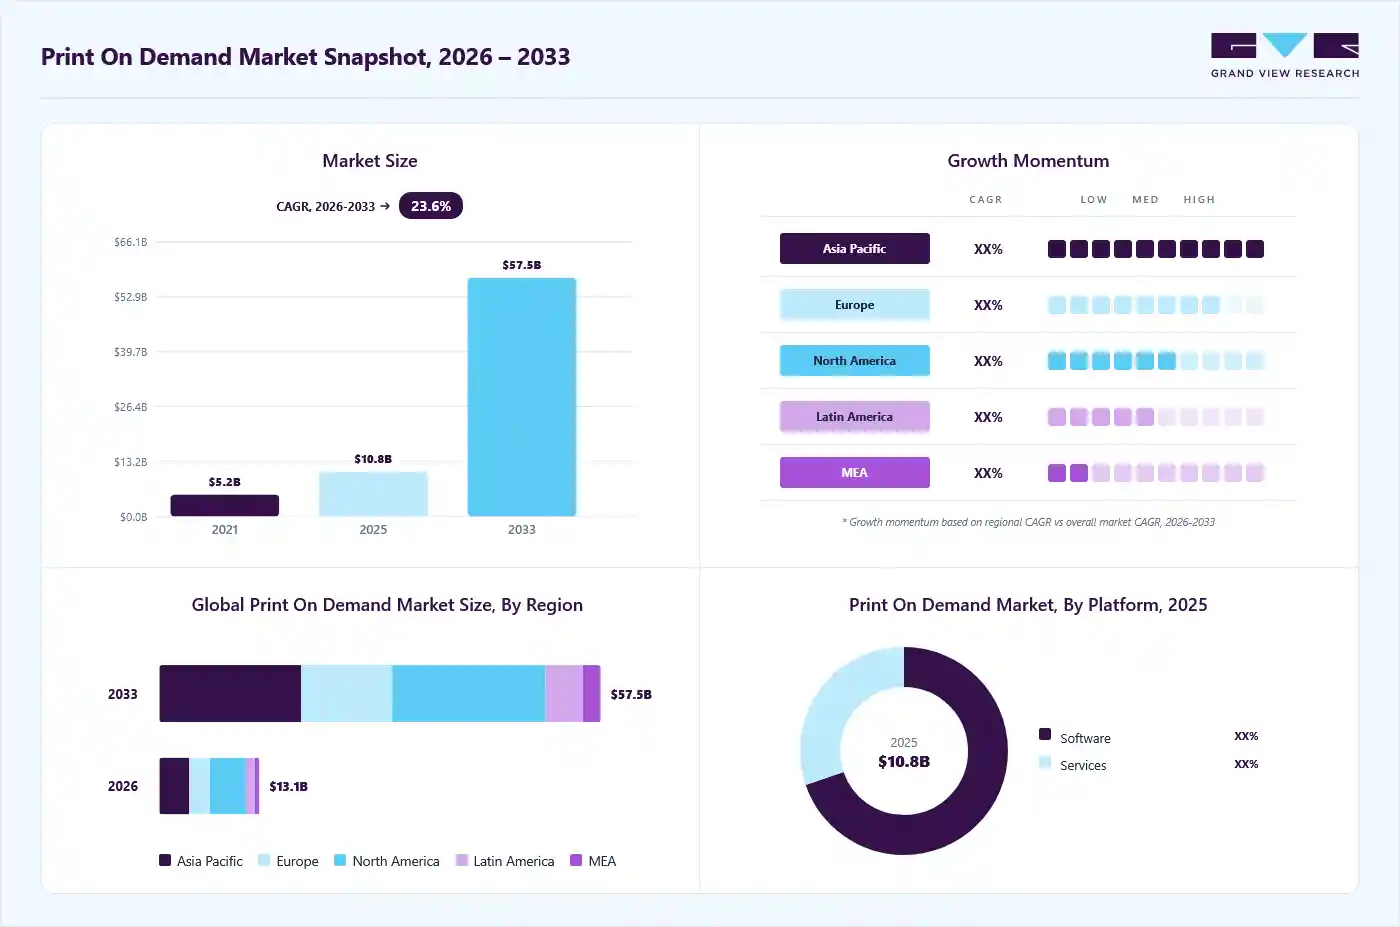
Grand View Research puts the global POD market at $10.8 billion in 2025 and $13.1 billion in 2026. By 2033, it expects $57.5 billion, with growth of around 23.6% a year. Do the math and the market gets more than five times bigger in eight years.
2. North America Holds 36% of the Global Market
North America made up 36% of global POD revenue in 2025, and the U.S. was the biggest single country. Grand View Research credits good tech infrastructure, stable economies, and local production in the region.
3. Asia Pacific Is the Fastest-Growing Region
Asia Pacific is smaller, but it's growing faster than anywhere else, at 24.8% a year through 2033. The push comes from more internet users, more smartphones, and a lot of people already shopping online.
4. Sustainability Drives Growth in Europe
European shoppers pay close attention to waste and overproduction. Grand View Research says demand for sustainable products is a big reason they pick POD, and strict EU rules push brands the same way.
Made-to-order fits neatly here. Nothing gets printed until someone buys it, so there's no unsold stock.
5. Personalization Is the Main Driver of Demand
Grand View Research points to growing demand for personalized products like custom apparel, home decor, accessories, and drinkware. A lot of these are bought as gifts for special occasions.
In the U.S., the creator economy adds fuel. Artists and small brands can sell merch without paying for stock first.
6. Apparel Makes Up 39.5% of the POD Market
Apparel is still the biggest slice, at 39.5% of the market in 2025. More fashion shopping has moved online, and younger buyers want clothes nobody else has. The catch: Mordor Intelligence says the category is getting crowded and margins are thin.
7. Home Decor Is the Fastest-Growing POD Product Category
Home decor is growing at 24.5% a year, faster than any other product. Remote work is part of it. People spend more time at home and want the space to feel like theirs.
There's also more to pick from now, like mats, cushions, and posters. The same report even calls decor a hedge against apparel price wars.
8. DTF Is the Fastest-Growing POD Printing Method
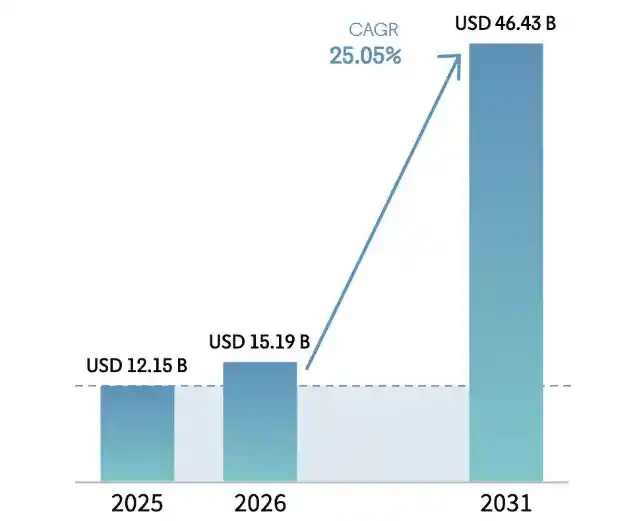
DTF printing puts a design on a special film, then heat-presses it onto the product. It's growing faster than any other method, at 28.15% a year through 2031. It skips pre-treatment, cuts white ink use by about 40%, and works on more fabrics.
DTG, which sprays ink right onto fabric, still had the biggest share in 2025 at about 44%. But DTF's simpler process helps lower the cost per item.
9. Businesses Account for 74% of Revenue
Most POD revenue doesn't come from individual shoppers. Businesses brought in about 74% of it in 2025, through branded merch, marketing giveaways, seasonal campaigns, and event drops.
For a small seller, that points to a second kind of buyer. Teams, clubs, and local shops all need branded merch, often for events or each new season.
10. Individual Creators Are the Fastest-Growing Group of POD Users
Individual creators are a smaller group for now, but they're growing fastest, at 27.20% a year through 2031. Social platforms make it simpler to turn followers into buyers, and you don't need a big brand to do it.
11. "Print on Demand" Gets About 90,200 Monthly Searches Worldwide
We checked Semrush in October 2026. The keyword "print on demand" gets about 90,200 searches a month worldwide. Around 22,200 come from the U.S., roughly a quarter. The UK, Germany, and India come next, so interest isn't limited to one country.
12. More Than 228,000 Active Stores Use POD
More than 228,000 active online stores now use zero-inventory fulfillment. Most new sellers are small businesses that can't afford to stock up before they make a sale, which helps explain the number.
13. Marketplaces Bring In About 60% of Revenue
Marketplaces brought in about 60% of POD revenue in 2025. They already have the traffic and the trust. In exchange, sellers pay commission fees and live with whatever the platform's search algorithm decides.
14. Independent Stores Are Growing Faster Than Marketplaces
Independent stores are catching up. They're growing 25.90% a year through 2031, faster than marketplaces. Running your own site means no commissions, your own customer data, and full control of your branding. We'll put the fees side by side later in this post.
15. Etsy Has 5.6 Million Active Sellers
Etsy had 5.6 million active sellers at the end of 2025, down 1.5% from 2024. That's every seller on Etsy, not just POD shops. It still gives you a sense of how crowded the site is.
16. Etsy's App Drives About 46% of Its Sales
The Etsy app brought in about 46% of Etsy's sales in the last quarter of 2025, and app sales grew 6.6% over the year before. Close to half of what sells on Etsy goes through the app.
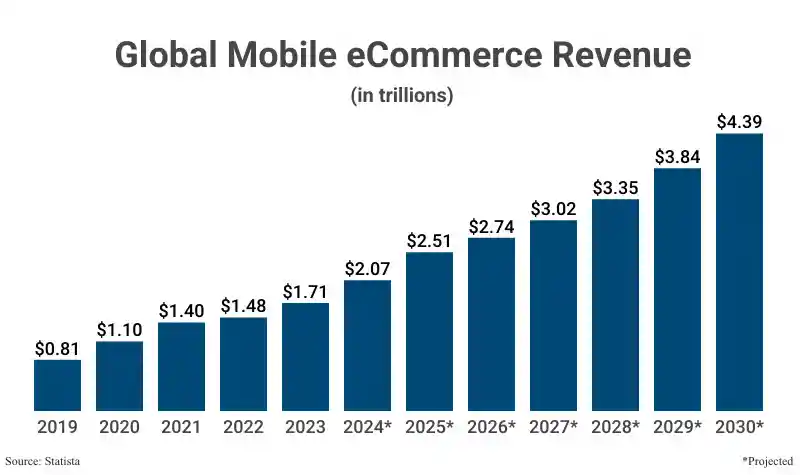
17. 60% of Global Online Sales Happen on Mobile
Capital One Shopping reports that about 60% of global online sales now happen on mobile devices. It expects that share to hit 67% by 2030.
Etsy's numbers in #16 point the same way. Most of your buyers will likely see your product on a small screen first.
18. Average Seller Margins Sit Near 20%
Heavy discounting has dragged average seller margins down to around 20%. On a $25 shirt, that's about $5 of profit.
Margin is the share of each sale you keep after costs. At 20%, there's little room for error. A 20%-off coupon on that same shirt takes $5, which wipes out the whole profit.
Keep in mind this is an average. Sellers who skip deep discounts can do better.
19. Only 24% of Stores Last Three Years
An estimated 24% of POD stores are still open after three years. Put another way, roughly 3 in 4 shut down first.
Starting is cheap. You don't pay for stock up front, so lots of people give it a try. As the margin stat above shows, many then compete on price and end up with thin profits.
If you want to be in the 24%, know what each order really earns before you set a price. Our cost breakdown later in this post walks through one sale.
20. New US Import Rules Raise Costs for Cross-Border Sellers
On August 29, 2025, the U.S. suspended its $800 duty-free rule for small parcels from every country. In June 2026, U.S. Customs made the pause indefinite.
A 2025 law ends the rule for good on July 1, 2027. Overseas sellers now pay import duties on POD products shipped into the U.S. Market analysts expect this to move production closer to U.S. buyers.
21. Generative AI Can Lift Online Sales by Up to 16.3%
A field study on a large cross-border shopping platform tested generative AI in several parts of the business. Sales rose anywhere from 0% to 16.3%, depending on where it was used. The biggest gains came from pre-sale chat, search, and product descriptions.
The researchers saw signs that smaller and newer sellers gained more, but they say that part is less certain. The 16.3% showed up where the old process was weakest.
What One POD Sale Really Earns: T-Shirt Cost Breakdown
Market reports put average seller margins at around 20%. That number is useful, but it doesn't show where the money from one order actually goes. So we priced out a single shirt, line by line.
The Shirt We Used
We picked PrintKK's Unisex Cotton T-Shirt (Gildan 5000). It's 100% cotton, printed with DTF, and made in the USA. As of October 2026, the base price is $9.90 for sizes S to XL, $10.90 for 2XL, and $11.88 for 3XL.
Here’s a nice perk: this shirt ships free within the U.S. That means you don’t pay a shipping fee on each order, so more of every sale stays in your pocket. At a $25 retail price and a $9.90 base cost, you keep about $15.10 per shirt before other fees.
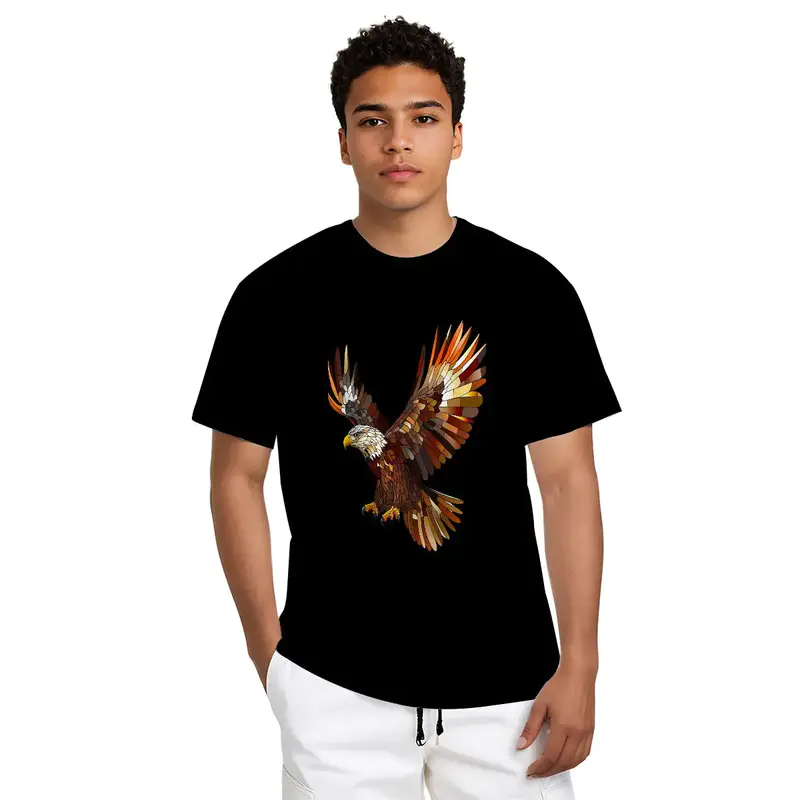
Custom Unisex Cotton T-Shirt | Gildan 5000 (Made in USA) - Print on Demand Fulfillment - PrintKK
The Numbers on a $25 Shirt
| Line item | Amount | What's left |
|---|---|---|
| Retail price | +$25.00 | $25.00 |
| Base price | −$9.90 | $15.10 |
| U.S. shipping | $0.00 | $15.10 |
| Ad spend (assumed) | −$5.00 | $10.10 |
| Profit before platform fees | $10.10 |
That's about 40% of the sale before any platform takes its cut. This table assumes the shirt sells at full price and never comes back. Discounts and returns would both lower that number.
Why Our Example Beats the 20% Average
The gap comes down to a few things. Many sellers discount heavily to compete on price. Paid shipping and bigger ad budgets push margins down further. Our example has free shipping and no discounts, so it sits on the better end of what sellers see.
How Ad Spend Changes the Math
Ad costs depend on your niche, your ads, and how well your listing turns clicks into sales. There's no reliable average for sellers, so we used $5 per order as an example.
Every extra dollar you spend on ads comes straight out of profit. At $10 per order, you'd have $5.10 left before platform fees. If your sales come from free traffic, like Etsy search or your own social posts, you skip that line and keep $15.10.
What About Sales Tax?
In the U.S., sales tax isn't a cost for you. The buyer pays it on top of the price. Marketplaces like Etsy usually collect it and send it to the state for you. On your own store, you collect it at checkout and pass it on. Either way, it stays out of your profit math.
Next Up: Platform Fees
$10.10 still isn't what lands in your bank account. Every platform charges fees, and they're different on Etsy, Shopify, and TikTok Shop. The next section uses the same $25 shirt to show how much you actually keep on each one.

How Much You Keep After Fees on Etsy, Shopify, and TikTok Shop
Marketplaces bring in most sales, but sellers pay for that traffic. Market reports say platform fees can eat up to a quarter of a seller's revenue. Independent stores are growing faster, partly to avoid those cuts.
So we ran the same $25 shirt from the last section through all three platforms. We started from the $10.10 left after the base price and $5 in ads. Fees below are U.S. rates as of October 2026.
Fees on a $25 Shirt, Side by Side
| Etsy | Shopify (Basic) | TikTok Shop | |
|---|---|---|---|
| Profit before platform fees | $10.10 | $10.10 | $10.10 |
| Listing fee | −$0.20 | — | — |
| Transaction or referral fee | −$1.63 | — | −$1.50 |
| Payment processing | −$1.00 | −$1.03 | Included |
| Monthly plan, per order* | — | −$0.78 | — |
| What you keep | $7.27 | $8.29 | $8.60 |
*$39 a month spread over 50 orders.
On a basic sale, fees take about 6% to 11% of the price. That's well under a quarter. The bigger hits come from the extra fees below.
Etsy: Watch for Offsite Ads
Etsy charges $0.20 to list, a 6.5% transaction fee, and 3% + $0.25 for payment processing. If a buyer clicks one of Etsy's Offsite Ads before buying, you also pay a 15% ad fee.
On our shirt, that's another $3.75. You'd keep $3.52, and total fees would land right around a quarter of the sale.
Shopify: The Monthly Plan Adds Up
Shopify's Basic plan costs $39 a month, or $29 a month if you pay yearly. Online card payments cost 2.9% + 30¢ each, and premium cards like Amex cost more.
The plan fee is fixed, so it hurts most when orders are slow. At 10 orders a month, it's $3.90 per shirt instead of $0.78. Shopify also has no built-in shoppers, so you may need to spend more than $5 on ads.
TikTok Shop: Lowest Fee, With a Catch
TikTok's posted U.S. fee is a flat 6% referral fee, and it already includes payment processing. Several seller sites report a rise to 8% in August 2026, but TikTok's public fee table still shows 6%. At 8%, you'd keep $8.10. Check your rate in Seller Center.
The bigger cost is creator commissions. If an affiliate sells your shirt, you'll often pay them 10% to 20%. At 15%, that's $3.75 more, leaving $4.85.

How to Use Data to Improve Your POD Store
Numbers only help if they change what you do. Here are five moves that come straight from the stats above.
1. Add a Few Home Decor Products
Home decor is the fastest-growing category. You don't need a new brand to try it. Take your best-selling shirt design and put it on a poster or pillow first. If it sells, add more.
2. Let Buyers Personalize Something
Demand for personalized products is a main reason the market keeps growing, and many of those orders are gifts.
Pick two or three best sellers and add a field for a name, date, or initial. Gift buyers often search with words like "custom" or "personalized," so put those words in your titles too.
3. Check Every Listing on Your Phone
About 60% of online sales happen on mobile, and Etsy's app alone drives close to half of Etsy's sales. Open your own listings on a phone. Can you read the design in the small thumbnail? If not, zoom in on the print in your first photo or try a bolder design.
4. Sell on a Marketplace and Your Own Store
Marketplaces bring in most POD revenue because shoppers are already there. Your own store grows faster, and you keep your customer data. In our fee table, the same shirt earned $8.29 on Shopify versus $7.27 on Etsy. Use a marketplace to get found, then send repeat buyers to your own site.
5. Print Close to Your Buyers
Since the U.S. suspended its $800 duty-free rule, overseas parcels now pay import duties. If most of your buyers are in the U.S., pick products that are made and shipped there. As our cost breakdown showed, a U.S.-made shirt can ship for free, which protects your margin.
Read More:

Design Trending Products with PrintKK
Turn the Numbers Into Your Next Product
The trends point in a clear direction. Home decor is growing fastest, buyers want personalized items, and most shoppers browse on a phone. A good next step is one decor product with a bold design that reads well on a small screen and lets buyers add a name. Make it on PrintKK, test it next to your best seller, and see which one moves.
Let AI Speed Up the Design Work
In one large study, generative AI lifted online sales by up to 16.3%, and smaller sellers may gain more. That's a good reason to hand the slow parts of the job to an AI design tool, like sketching first drafts and trying new ideas.
The tool is free and built right in, so you can go from idea to product mockup in one place. When a design is ready, push it straight to your store.
The platform connects with Shopify, Etsy, WooCommerce, Wix, eBay, and more, so new products go live without manual uploads.
Expert Tips
The print-on-demand market keeps changing, but the data makes it easier to follow. You now know how big the market is, which products sell well, what profits look like, and which trends matter in 2026.
Keep these print-on-demand statistics in mind as you build your store. Check them when you add new products or adjust your prices. Small, data-based choices add up over time. Track your own sales data too, and let both guide your growth.